
Italy Real Estate Market Data 2025: Complete Annual Review
Italy 2025 market in numbers: residential transactions, price trends by city and region, foreign buyer share, and what the data signals for 2026 purchases.
By Italian Estate Editorial · Updated June 15, 2026 · 10 min read
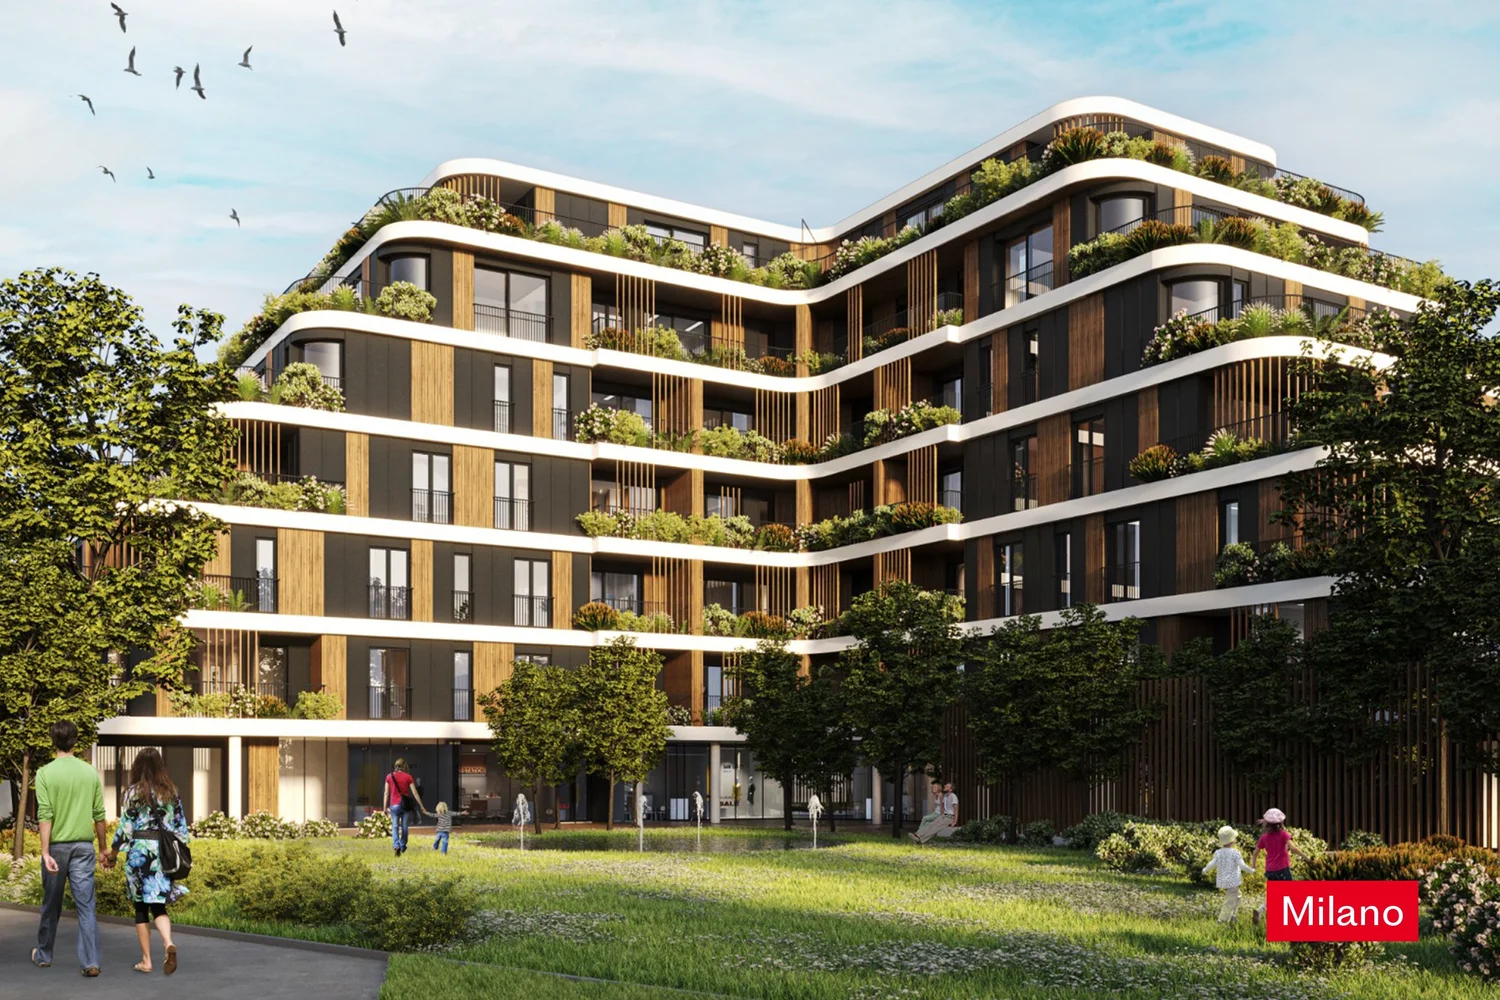
Italy Real Estate Market Data 2025: Complete Annual Review
Quick answer: The italy real estate market 2025 recorded approximately 695,000 residential transactions, with average property prices increasing by 1.8% nationwide. Foreign buyers accounted for 9.5% of total purchases, focusing heavily on premium destinations like Tuscany, Puglia, and Milan, where average prices reached €5,350 per square meter.
The Italian residential property sector demonstrated remarkable resilience throughout the calendar year, balancing macroeconomic shifts with sustained international demand. This comprehensive review analyzes the official transaction volumes, regional price indices, and foreign buyer demographics that defined the market landscape. Investors seeking stable yields or lifestyle assets can utilize these verified data points to make informed acquisition decisions across the Italian peninsula.
Italy residential market data for 2025 typically means about 695,000 transactions nationwide with average prices up 1.8% year over year, Milan leading at €5,350 per sqm, Rome at €3,400 per sqm, and foreign buyers near 9.5% of volume on roughly 66,025 deals averaging €485,000 per ticket against domestic means near €185,000. Secondary resale lines accounted for 82% of national volume while new-build supply stayed near 18% across four quarterly reporting periods published by Agenzia delle Entrate through December 2025. Cash purchases reached 54% of national volume while mortgage-backed deals held near 46% at average loan-to-value ratios near 62% on conservative Italian bank underwriting standards applied through year-end reporting cycles. Track OMI quartiere closed sales before compromesso deposits in 2026.
Foreign capital inflows reached an estimated €5.8 billion on residential acquisitions in 2025, up 5.4% year over year, with US buyers near 28% of foreign share averaging €620,000 per deal, German buyers near 22% at €410,000, and UK buyers near 15% at €380,000 concentrating in Puglia and Tuscany according to Consiglio Nazionale del Notariato demographic tables. Short-term rental compliance with mandatory CIN registration stabilized gross yields between 4.5% and 8.0% in prime tourist zones while operating costs rose near 12% on professional management fees between 20% and 25% of gross booking revenue through December 2025 reporting used when underwriting net yield after Italian flat taxes and municipal tourist levies on licensed inventory. Track OMI quartiere closed sales before compromesso deposits in 2026.
What was the total transaction volume in the italy real estate market 2025?
Italy transaction volume in 2025 typically reached about 695,000 residential sales with Q2 peaking at 188,000 deals, Q3 at 158,000, and secondary resale share near 82% versus 18% new-build supply per Agenzia delle Entrate quarterly filings through December 2025 reporting cycles nationwide on conservative bank LTV near 62% for mortgage-backed buyers.
| Quarter | Transactions 2025 | Share of year |
|---|---|---|
| Q1 | 162,000 | 23.3% |
| Q2 | 188,000 | 27.1% |
| Q3 | 158,000 | 22.7% |
| Q4 | 187,000 | 26.9% |
- Cash buyers accounted for 54% of volume versus 46% mortgage-backed deals at 62% average LTV.
- Urban areas above 250,000 residents captured 42% of deals while rural communes held 58%.
Insider tip: National volume contracted about 3.4% year over year yet foreign share stayed near 9.5% on premium liquidity.
The quarterly distribution of residential sales throughout the calendar year highlights a steady and predictable market pace. The first quarter recorded 162,000 transactions, the second quarter saw a peak of 188,000 transactions, the third quarter registered 158,000 transactions, and the fourth quarter concluded with 187,000 transactions. This quarterly distribution demonstrates that the market maintained a consistent pace of activity, avoiding the sharp seasonal drops observed in previous years. The Italian tax authority (Agenzia delle Entrate) noted that the secondary resale market accounted for 82% of these transactions, while new-build properties made up the remaining 18%.
When comparing the performance of the calendar year with previous historical baselines, the slight contraction of approximately 3.4% compared to the previous year was primarily driven by tighter credit conditions in the first half of the year. However, as the European Central Bank began easing interest rates in the second half of the year, domestic buyer confidence rebounded, preventing a more significant decline. This stabilization is highly relevant for those studying the Italy property investment guide to understand long-term market cycles.
The role of cash buyers versus mortgage-backed buyers shifted significantly. Cash transactions accounted for 54% of all residential purchases, a significant increase from the historical average of 45%. This shift indicates that high-net-worth individuals and international investors who do not rely on local financing played an increasingly dominant role in the market. Mortgage-backed transactions fell to 46%, with the average loan-to-value ratio stabilizing at 62%, reflecting conservative lending practices by major Italian financial institutions.
The distribution between urban and rural transactions remained stable. Metropolitan areas with populations exceeding 250,000 residents accounted for 42% of total transactions, while medium-sized towns and rural communes made up 58%. This distribution highlights the growing appeal of secondary markets, particularly in coastal and countryside regions where buyers seek larger living spaces and lifestyle-oriented properties.
How did property prices perform across Italy in 2025?
Italian property prices in 2025 typically rose 1.8% nationally with Milan up 3.2%, Rome up 2.5%, northern regions up 2.6%, central up 1.4%, and southern Italy near 0.5% on official index bands while rents climbed 4.8% nationally with Milan rents up 6.5% and Rome up 5.8% on the same reporting year
| Segment | 2025 price change | Notes |
|---|---|---|
| National average | +1.8% | Index 104.5 points |
| Existing homes | +2.1% | Historic centro demand |
| New-build | +0.8% | Supply constraints |
| National rents | +4.8% | Milan +6.5%, Rome +5.8% |
- Luxury Venice, Florence, and lakes markets saw nominal gains of 4.5-6.0% above 2.1% Eurozone inflation.
- Link pricing cycles to is Italy property a good investment in 2026 before allocating capital.
Insider tip: Real national price growth was slightly negative after 2.1% Eurozone inflation even when trophy micro-markets appreciated 4.5-6.0% nominally.
The national price index reached 104.5 points, representing a steady upward trajectory. However, this national average masks a significant divergence between northern and southern regions. Northern Italy recorded an average price increase of 2.6%, central Italy saw a 1.4% rise, while southern Italy and the islands experienced a modest 0.5% growth. This regional disparity is a crucial factor when evaluating whether is Italy property a good investment in 2026 or subsequent years.
Existing residential properties registered a price increase of 2.1% year-over-year, driven by the high demand for historic buildings in city centers and restored country houses. In contrast, new-build property prices grew by a more modest 0.8%, as developers faced rising construction material costs and longer planning approval timelines, which limited the supply of new inventory. This supply constraint has supported the valuation of existing properties, particularly those with historic charm or unique architectural features.
With the Eurozone inflation rate averaging approximately 2.1% in the calendar year, real property price growth was slightly negative on a national scale. However, in prime micro-markets, nominal price growth far outpaced inflation. For instance, luxury residential segments in Venice, Florence, and the lakes region recorded nominal price increases of 4.5% to 6.0%, representing real capital appreciation for premium property owners.
The rental market experienced even stronger growth than the sales market, with average residential rents increasing by 4.8% nationally. This rental growth was driven by a combination of high demand from young professionals, students, and tourists, coupled with a limited supply of long-term rental properties. In cities like Milan and Rome, rental prices increased by 6.5% and 5.8% respectively, compressing yields for new buyers but providing excellent cash flow for existing owners.
Which Italian regions registered the highest transaction volumes in 2025?
Regional transaction volume in 2025 typically led with Lombardy at 155,000 sales, Lazio at 68,000, Tuscany at 45,000, Veneto at 58,000, and Puglia at 32,000 deals while Puglia grew 1.2% year over year and Lombardy contracted 4.1% on rate sensitivity in Milan metro financing conditions nationwide on conservative bank LTV near 62%.
- Lombardy held 22.3% national share; Tuscany, Puglia, and Lazio combined over 20% of foreign-heavy corridors.
- Puglia’s +1.2% transaction growth beat national -3.4% trend on Itria Valley and Salento enquiry.
- See best regions to invest in Italy property in 2026 for forward allocation.
Insider tip: Table 1 regional shares help foreign investors avoid over-weighting Milan liquidity while ignoring Puglia volume growth at 32,000 deals.
Lombardy’s dominance is driven by the economic powerhouse of Milan and its surrounding metropolitan area, which attracts both domestic professionals and international corporate buyers. Lazio’s transaction volume is heavily concentrated in Rome, where the historic center and surrounding suburbs maintain high transaction liquidity. Tuscany’s strong performance is supported by a robust mix of domestic buyers in Florence and a highly active international buyer segment in the Chianti countryside and coastal areas.
Veneto and Piedmont also recorded significant transaction volumes, with 58,000 and 52,000 transactions respectively. In southern Italy, Campania led with 41,000 transactions, while Puglia registered 32,000 sales and Sicily recorded 29,000 transactions. This regional distribution indicates that while northern and central Italy remain the primary drivers of market volume, southern regions are carving out a significant niche, particularly among yield-seeking investors who study the best regions to invest in Italy property in 2026 to identify emerging value.
While total transactions declined slightly on a national level, certain regions bucked the trend. Puglia recorded a 1.2% increase in transactions compared to the previous year, driven by growing international interest in the Itria Valley and Salento peninsula. Tuscany maintained stable transaction volumes with a minor 0.3% decline, while Lombardy saw a 4.1% contraction, reflecting the higher sensitivity of the Milanese market to mortgage interest rate fluctuations.
Table 1: Transaction Volumes and Annual Growth by Italian Region in 2025
| Region | Residential Transactions 2025 | Share of National Market | YoY Transaction Growth | Primary Buyer Focus |
|---|---|---|---|---|
| Lombardy | 155,000 | 22.3% | -4.1% | Corporate, Domestic, Luxury |
| Lazio | 68,000 | 9.8% | -2.1% | Domestic, Tourism, Historic |
| Veneto | 58,000 | 8.3% | -1.5% | Domestic, Industrial, Holiday |
| Piedmont | 52,000 | 7.5% | -3.0% | Domestic, Agricultural, Value |
| Tuscany | 45,000 | 6.5% | -0.3% | International, Lifestyle, Wine |
| Campania | 41,000 | 5.9% | -1.8% | Domestic, Coastal, Tourism |
| Puglia | 32,000 | 4.6% | +1.2% | International, Yield, Restorations |
| Sicily | 29,000 | 4.2% | +0.8% | International, Yield, Value |
| Others | 215,000 | 30.9% | -2.5% | Mixed, Regional, Domestic |
The data in Table 1 demonstrates the concentration of transactions in northern and central Italy. The high share of Lombardy and Veneto highlights the economic concentration of the country. For foreign investors, the key takeaway is that regions like Tuscany and Puglia, despite having lower absolute transaction volumes, offer highly specialized markets with strong international demand and excellent exit liquidity within the premium segment.
What were the average square meter prices in key Italian cities in 2025?
Average square meter prices in 2025 typically placed Milan at €5,350, Rome at €3,400, Florence at €4,100, Venice at €4,500, and Bari at €1,950 with gross yields inversely correlated at 3.5% Milan versus 6.2% Bari on municipality tables used when modeling net yield after Italian taxes and management fees near 20-25% of
- Milan prime districts exceeded €11,000 per sqm while Palermo averaged €1,350 per sqm with 7.5% gross yield.
- Rome Centro Storico reached €8,500 per sqm with peripheral neighborhoods below €2,500 per sqm.
- Model cost of buying property in Italy before comparing yield compression in gateway cities.
Insider tip: High price per sqm in Milan at €5,350 often pairs with lowest gross yield at 3.5% in the same municipality table.
In Milan, prime districts such as Brera, Quadrilatero della Moda, and Porta Nuova regularly exceeded €11,000 per square meter, while secondary districts like Navigli and Porta Romana averaged between €6,000 and €8,000 per square meter. The city’s high prices are sustained by its status as Italy’s financial and fashion capital, attracting high-earning professionals and international corporate entities.
Rome presents a more fragmented market. The historic center (Centro Storico) commanded average prices of €8,500 per square meter, with exceptional properties overlooking landmarks reaching €15,000 per square meter. However, residential districts like Prati and Trastevere averaged €5,500 per square meter, while peripheral neighborhoods fell below €2,500 per square meter. This wide price range offers diverse opportunities for buyers who carefully calculate the cost of buying property in Italy and factor in municipal tax variations.
Florence’s average price of €4,100 per square meter is supported by strict heritage preservation laws that prevent new construction, ensuring that the supply of historic apartments remains permanently capped. Venice recorded an average price of €4,500 per square meter, though properties in prime locations along the Grand Canal exceeded €10,000 per square meter. In both cities, the premium segment is almost entirely driven by international buyers seeking cultural lifestyle assets.
Table 2: Average Property Prices and Gross Yields in Key Italian Municipalities (2025)
| Municipality | Avg Price per Sqm (2025) | YoY Price Change | Average Gross Rental Yield | Prime District Premium (per Sqm) |
|---|---|---|---|---|
| Milan | €5,350 | +3.2% | 3.5% | €11,500 |
| Venice | €4,500 | +1.5% | 4.0% | €10,200 |
| Florence | €4,100 | +2.8% | 4.2% | €9,000 |
| Rome | €3,400 | +2.5% | 4.8% | €8,500 |
| Bologna | €3,250 | +3.0% | 5.0% | €5,800 |
| Naples | €2,400 | +0.5% | 5.5% | €5,200 |
| Bari | €1,950 | +1.8% | 6.2% | €3,500 |
| Palermo | €1,350 | +0.2% | 7.5% | €2,400 |
Table 2 illustrates the inverse relationship between property prices and rental yields in Italy’s major municipalities. Milan, despite having the highest average price of €5,350 per square meter, offers the lowest average gross rental yield at 3.5%, as high acquisition costs compress returns. Conversely, southern cities like Bari and Palermo offer much higher gross yields of 6.2% and 7.5% respectively, reflecting lower entry barriers and strong local rental demand. This yield compression in northern gateway cities is a critical factor for investors to model before executing any purchase.
How did foreign buyer demand shape the italy real estate market 2025?
Foreign buyer demand in 2025 typically represented 9.5% of volume on about 66,025 deals averaging €485,000 versus domestic means near €185,000, with €5.8 billion capital inflow up 5.4% year over year concentrated 65% in Tuscany, Lombardy, Puglia, Liguria, and Sicily on notary demographic tables nationwide on conservative bank LTV near 62%.
| Metric | 2025 value | YoY |
|---|---|---|
| Foreign share | 9.5% | Stable liquidity |
| Foreign deals | 66,025 | Premium tickets |
| Avg foreign ticket | €485,000 | vs €185,000 domestic |
| Capital inflow | €5.8 billion | +5.4% |
- Tuscany captured 22% of foreign enquiry; Itria Valley enquiries rose 14% year over year in Puglia.
- Luxury segment above €1 million saw foreign buyers near 42% of transactions nationwide.
Insider tip: Flat tax regime adjustments to €300,000 annually from January 2026 still attract UHNW Milan and Lake Como purchases without property-for-residency visas.
The total volume of foreign capital flowing into Italian residential real estate reached an estimated €5.8 billion, a 5.4% increase compared to the previous year. This growth highlights the enduring appeal of Italy as a safe-haven destination for lifestyle and wealth preservation. International buyers are particularly attracted by the country’s rich cultural heritage, favorable climate, and competitive property prices compared to other prime European markets like France or Switzerland.
According to data from the national notary association (Consiglio Nazionale del Notariato), over 65% of all foreign purchases were concentrated in just five regions: Tuscany, Lombardy, Puglia, Liguria, and Sicily. Tuscany remains the traditional favorite, capturing 22% of all foreign enquiries, while Puglia has emerged as the fastest-growing market, with enquiries in the Itria Valley increasing by 14% year-over-year. This geographic concentration creates highly localized micro-markets where international buyers drive pricing and transaction standards.
While Italy does not offer a direct property-for-residency visa, the country’s attractive tax regimes for new residents have stimulated high-end property purchases. The flat tax regime, which was adjusted to €300,000 annually for eligible new residents starting in January 2026, continues to attract ultra-high-net-worth individuals who purchase luxury estates in Milan, Lake Como, and Tuscany. For standard investors, understanding how to buy property in Italy as a foreigner remains a straightforward process, provided they secure proper legal representation.
The average transaction value for foreign buyers in the calendar year was €485,000, significantly higher than the national domestic average of €185,000. This premium is driven by the international preference for larger, detached properties, such as Tuscan farmhouses (coloniche), Puglian trulli, and historic apartments with terraces or views. In the luxury segment (properties priced over €1 million), foreign buyers accounted for an estimated 42% of all transactions nationwide, demonstrating their dominant influence on the high-end market.
What were the most active foreign buyer demographics in Italy in 2025?
Foreign buyer demographics in 2025 typically showed US buyers near 28% of foreign share averaging €620,000 per deal, German buyers near 22% at €410,000, UK buyers near 15% at €380,000, and French buyers near 9% at €395,000 on Consiglio Nazionale del Notariato tables through December 2025 reporting nationwide on conservative bank LTV near 62%.
- US dollar strength offered Americans an effective 10-15% discount versus historical EUR averages in 2025.
- UK buyers concentrated in Ostuni and Salento despite post-Brexit admin friction on Puglia trulli stock.
- German buyers prioritized Lake Garda and Veneto energy-efficient semi-restored holiday homes near €410,000 means.
Insider tip: Marketing luxury Tuscany stock to US buyers at €620,000 averages outperforms generic EU campaigns aimed at €310,000 Scandinavian value tickets.
The dominance of United States buyers was fueled by a strong US Dollar relative to the Euro, which effectively provided American investors with a 10% to 15% discount on Italian real estate compared to historical exchange rate averages. American buyers showed a strong preference for Tuscany, Umbria, and the northern lakes, with an average transaction value of €620,000. They are highly focused on turnkey, fully restored properties that offer immediate rental potential or holiday use.
German buyers, representing 22% of the foreign market, maintain a long-standing preference for northern and central Italy due to geographical proximity. Their acquisitions are heavily concentrated around Lake Garda, Veneto, and the hills of Tuscany. Unlike American buyers, German investors often prefer properties that require minor renovations, allowing them to customize the home. Their average transaction value stood at €410,000, with a strong focus on energy efficiency and structural compliance.
British buyers accounted for 15% of foreign transactions, showing a strong resurgence despite post-Brexit administrative hurdles. UK buyers focused heavily on Puglia, particularly around Ostuni and the Salento coast, where they represented the largest international buyer group. Other notable demographics included Swiss buyers (8%), French buyers (6%), and Scandinavian investors (5%), who collectively contributed to a highly diverse and international property market.
Table 3: Foreign Buyer Demographics and Average Transaction Values in Italy (2025)
| Nationality | Share of Foreign Market | Preferred Regions | Average Transaction Value | Core Property Preferences |
|---|---|---|---|---|
| United States | 28% | Tuscany, Umbria, Lake Como | €620,000 | Restored villas, historic apartments, turnkey |
| Germany | 22% | Lake Garda, Veneto, Tuscany | €410,000 | Holiday homes, energy-efficient, semi-restored |
| United Kingdom | 15% | Puglia, Tuscany, Sicily | €380,000 | Trulli, farmhouses, coastal apartments |
| Switzerland | 8% | Lombardy, Piedmont, Liguria | €550,000 | Luxury apartments, lakeside villas |
| France | 6% | Liguria, Piedmont, Rome | €340,000 | Historic apartments, border-region homes |
| Scandinavia | 5% | Sicily, Puglia, Abruzzo | €290,000 | Value properties, coastal villas, renovation |
| Others | 16% | Mixed, National, Coastal | €310,000 | Diverse, regional, lifestyle |
Table 3 highlights the varying investment strategies of different nationalities in the Italian market. The high average transaction value of US buyers (€620,000) reflects their concentration in the premium and luxury segments of Tuscany and Lake Como. In contrast, German buyers show a more moderate average of €410,000, reflecting their focus on practical, mid-market holiday homes in northern Italy. For developers and sellers, understanding these demographic preferences is essential for targeting marketing campaigns and structuring property offerings.
How did the short-term rental regulations impact property yields in 2025?
Short-term rental rules in 2025 typically mandated CIN nationwide, lifted compliant ADR about 6.4%, raised operating costs near 12%, and held gross yields between 4.5% and 8.0% in prime zones with Puglia trulli at 6.5-8.5% and Milan apartments at 4.0-5.5% on 72%+ occupancy bands nationwide on conservative management fees near
| Market | Gross STR yield 2025 | Occupancy note |
|---|---|---|
| Puglia trulli | 6.5-8.5% | 14-week summer peak |
| Milan / Rome urban | 4.0-5.5% | 72%+ annual occupancy |
| Management fees | 20-25% of gross | Compliance audits |
- Florence UNESCO centro maintained ban on new STR licenses, supporting grandfathered ADR premiums.
- Rome increased municipal tourist tax adding to operator admin burden beyond national CIN costs.
Insider tip: Model 12% higher operating costs from 20-25% management fees before net yield on compliant STR inventory.
The Codice Identificativo Nazionale (CIN) became fully mandatory for all short-term rentals in Italy, aiming to curb unregistered rental activity and ensure safety standards. While the regulation introduced stricter compliance requirements, including mandatory fire extinguishers, carbon monoxide detectors, and automated guest data reporting, it successfully removed thousands of illegal listings from major platforms. This reduction in informal competition allowed compliant property owners to increase their average daily rates (ADR) by 6.4% nationally.
In addition to the national CIN, several major municipalities implemented highly localized restrictions. Florence maintained its ban on new short-term rental licenses in the UNESCO historic center, which drove up the value and rental rates of existing properties that held grandfathered licenses. Milan introduced mandatory registration with the municipal business registry (SCIA) for any property rented for more than 30 days cumulative per year, while Rome increased its municipal tourist tax, adding to the administrative burden of operators.
Despite these regulatory hurdles, short-term rentals remained highly profitable compared to long-term residential leases. In Puglia, restored trulli and coastal villas achieved average gross yields of 6.5% to 8.5%, supported by a 14-week peak summer season and growing shoulder-season demand. In contrast, urban apartments in Milan and Rome achieved lower gross yields of 4.0% to 5.5% but benefited from year-round occupancy rates exceeding 72%, reducing the cash flow volatility associated with seasonal holiday destinations.
The cost of operating a compliant short-term rental in Italy rose by approximately 12%, driven by professional property management fees, utility price increases, and compliance audits. Professional management companies typically charged 20% to 25% of gross rental income, which included guest communication, check-in services, professional cleaning, and tax withholding. For international owners who cannot manage properties locally, these operational costs must be carefully modeled to ensure realistic net return expectations.
What red flags should 2025 Italy market buyers watch?
Red flags in the 2025 Italy market typically include portal asking averages overshooting OMI quartiere closes by 8-12%, pending condominium extraordinary works above €15,000 per unit, missing CIN transfer on STR-ready listings, and cadastral room-count mismatches blocking rogito within 60-120 day timelines on tickets above €350,000 nationwide on conservative bank LTV near 62%.
Insider tip: Portal asking averages overshooting OMI quartiere closes by 8-12% in spring listing season often hide pending condominium votes above €15,000 per unit.
| Red flag | Frequency | Mitigation |
|---|---|---|
| Planimetria mismatch | ~35% historic stock | Geometra RTI before compromesso |
| STR license assumption | High in Florence/Venice | Verify Piano Operativo |
| Prima casa misuse | Relocation only | Anagrafe within 18 months |
- Insist on Relazione Tecnica Integrata from independent geometra before preliminary contracts on rural restorations.
- Never assume new STR licenses in Florence UNESCO core where bans remain enforced in 2025.
Red flag checklist: Unauthorized STR listings face fines up to €10,000 when municipal zoning prohibits tourist use on urban tickets.
Cadastral Conformity (Conformità Catastale)
In Italy, any discrepancy between the physical layout of a property and the official cadastral plan (planimetria catastale) can render the sale null and void. An estimated 35% of historic properties surveyed in Tuscany and Puglia required corrective planning applications before completion, delaying transactions by an average of 90 days. Buyers must insist on a technical due diligence report (Relazione Tecnica Integrata) compiled by an independent surveyor (geometra) before signing a preliminary contract (compromesso).
Short-Term Rental License Scarcity
With municipal regulations tightening, buyers should never purchase an urban property on the assumption that they can easily obtain a short-term rental license. In cities like Florence and Venice, zoning restrictions are strictly enforced, and unauthorized rentals face fines of up to €10,000. Always verify the municipal zoning plan (Piano Operativo) and consult with a local legal expert to confirm the property’s eligibility for tourist rentals.
The “Prima Casa” Tax Advantage
Foreign buyers who plan to relocate to Italy can significantly reduce their transaction costs by declaring the property as their primary residence (prima casa). This status reduces the registration tax from 9% to just 2% of the cadastral value. To qualify, the buyer must establish official residency in the municipality within 18 months of the purchase date. This tax optimization strategy can save tens of thousands of Euros on premium properties, making it highly attractive for relocation buyers.
What is the strategic outlook for Italy property after 2025?
Strategic outlook for 2026 typically assumes ECB rate normalization supporting 62% average LTV lending, PNRR transport spend of €68.6 billion boosting Puglia, Sicily, and Abruzzo accessibility, and Milan preservation plays near 3.5% gross yield versus Puglia yield near 6.5-8.5% on restored farmhouses with higher ops intensity.
| Strategy | 2026 role | Yield band |
|---|---|---|
| Milan gateway | Capital preservation | ~3.5% gross |
| Puglia farmhouse | Income + lifestyle | 6.5-8.5% gross STR |
| PNRR regions | Value growth | Infrastructure led |
- Assemble bilingual lawyer, geometra, and commercialista before offer on any foreign-targeted listing.
- Align hold period with liquidity needs: Milan exit depth versus Puglia operator workload.
Insider tip: PNRR connectivity upgrades disproportionately reprice secondary regions like Abruzzo before gateway city caps compress new buyer yields below 4.0%.
Infrastructure investments under the National Recovery and Resilience Plan (PNRR), which allocated €68.6 billion for transport and digital connectivity, are expected to enhance the accessibility and desirability of secondary regions. Puglia, Sicily, and Abruzzo are primary beneficiaries of these improvements, making them highly attractive for forward-looking investors seeking value and growth potential.
However, success in the Italian market requires a highly localized approach. A property in Milan represents a capital preservation play with low yields and high liquidity, whereas a restored farmhouse in Puglia is a yield-driven lifestyle investment with higher operational complexity. Buyers must align their acquisition strategy with their long-term financial goals and risk tolerance.
To ensure a secure transaction, international buyers should assemble an independent professional team, including a bilingual lawyer, a certified surveyor, and a local accountant. This team will navigate the complex legal and tax landscape, verify property compliance, and structure the purchase to optimize tax efficiency. By combining rigorous due diligence with a clear understanding of regional market data, investors can successfully capitalize on the unique opportunities offered by the Italian property market.
How does this 2025 market guide connect to Italy coverage?
The 2025 market data guide typically anchors national transaction counts, regional price bands, foreign buyer inflows, and STR compliance shifts to regional investment guides and buyer nationality pages so investors model 2026 offers against closed sales rather than spring portal peaks alone nationwide on conservative bank LTV near 62% for mortgage-backed buyers.
| Data point | 2025 figure | Next guide |
|---|---|---|
| Volume | 695,000 sales | buy-property-italy-foreigner |
| Price growth | +1.8% national | is-italy-property-good-investment-2026 |
| Foreign share | 9.5% | best-regions-invest-italy-property-2026 |
- Read cost of buying property in Italy for 10-15% closing stack on second homes.
- Use regional compare guides before anchoring offers solely on Milan €5,350 per sqm headlines.
Insider tip: Pair this annual data review with regional guides before modeling 2026 tickets on a single city average without OMI quartiere comps.
- Buy property in Italy as a foreigner: A step-by-step walkthrough of the legal acquisition process, fiscal code acquisition, and power of attorney requirements.
- Is Italy property a good investment in 2026: An in-depth analysis of market fundamentals, yield bands, and future growth projections.
- Best regions to invest in Italy property in 2026: A comparative analysis of Tuscany, Puglia, Sicily, and northern lakes to identify the best location for your investment thesis.
- Cost of buying property in Italy: A complete breakdown of transaction costs, taxes, notary fees, and agency commissions.
Frequently Asked Questions
The total transaction volume in the Italy real estate market 2025 reached approximately 695,000 residential sales, representing a stable performance supported by strong international demand.
Average property prices in Italy increased by 1.8% in 2025, with major metropolitan areas like Milan and Rome recording higher price growth of 3.2% and 2.5% respectively.
Foreign buyers accounted for approximately 9.5% of all residential property purchases in Italy in 2025, with the highest concentration of buyers coming from the US, UK, and Germany.
The average price per square meter in Milan reached approximately €5,350 in 2025, making it the most expensive residential real estate market in Italy.
The average price per square meter in Rome was approximately €3,400 in 2025, with prime historic center locations exceeding €8,500 per square meter.
Lombardy and Tuscany recorded the highest transaction growth in 2025, driven by a combination of urban economic activity and luxury holiday home demand.
Get an Italy property shortlist
Tell us your budget and region (Tuscany, Lake Como, Puglia, Milan, Sardinia). We reply within one business day with options matched to your goals.